Guides
gdb can be used in a plethora of environments. These guides help you get gdb and gdbgui working in specific environments.
Remember, these guides, like gdbgui, are open source and can be edited by you, the users! See contributing to modify these docs.
Running Locally
After downloading gdbgui, you can launch it like so:
gdbgui(or whatever the binary name is, i.e.gdbgui_0.10.0.0)gdbgui --args ./mybinary -myarg value -flag1 -flag2
Make sure the program you want to debug was compiled with debug symbols. See the getting started section for more details.
A new tab in your browser will open with gdbgui in it. If a browser tab did not open, navigate to the ip/port that gdbgui is being served on (i.e. http://localhost:5000).
Now that gdbgui is open, you can interactively run a program with it.
* Type the path to the executable in the input at the top (next to "Load Binary"). The executable should already exist and have been compiled with the -g flag.
* Click Load Binary. The program and symbols will load, but will not begin running. A breakpoint will be added to main automatically. This can be changed in settings if you prefer not to do this.
* The line of source code corresponding to main will display if the program was compiled with the -g flag debug symbols.
* Click the Run button, which is on the top right and looks like a circular arrow.
* Step through the program by clicking the Next, Step, Continue, icons as desired. These are also on the top right.
For a list of gdbgui arguments, run gdbgui --help.
Running Remotely
Because gdbgui is a server, it naturally allows you to debug programs running on other computers.
- ssh into the computer with the program that needs to be debugged.
- run
gdbgui -ron the remote machine (this will serve publicly so beware of security here) - on your local machine, open your browser and access the remote machine's ip and port
- debug the remote computer in your local browser
Note that gnu also distrubutes a program called gdbserver which gdbgui is compatible with. See the relevant section in this doc.
Debugging Rust Programs
gdbgui can be used to debug programs written in Rust. Assuming you use Cargo to create a new program
and build it in Debug mode in the standard way:
cargo new myprog
cd myprog
cargo build
You can start debugging with
gdbgui --args target/debug/myprog
There are a couple of small difficulties.
1.) Instead of showing your main function the initial screen will be blank and gdbgui will print File not found: main.
You need to help gdbgui out by typing main into the file browser box:
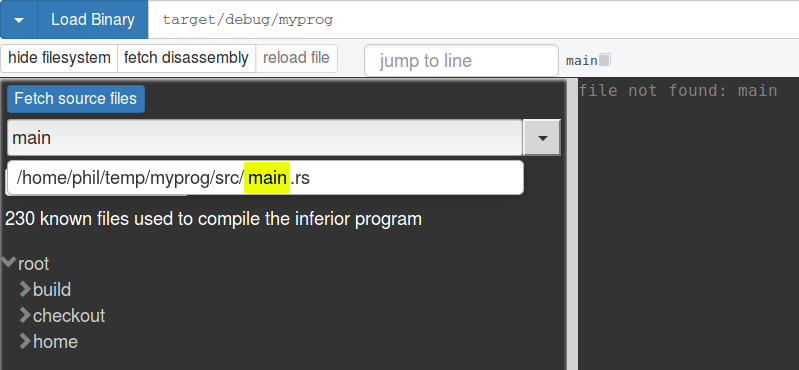
and selecting the main.rs file. The source code should then appear in the browser and you can click to set breakpoints
and run the program. Of course, if you want to break in some other file, you can find that in the file browser instead.
Rust on macOS
When you load your rust binary on a mac, you may see many warnings like this
warning /Users/user/examples/rust/target/debug/deps/hello-486956f9dde465e5.9elsx31vb4it187.rcgu.o': can't open to read symbols: No such file or directory.
Symbols are names of variables, functions and types defined in your program. You can define symbols for your program by loading symbol files. gdb usually does this automatically for you, but sometimes has trouble finding the right paths.
In this case, you need to manually tell gdb where the symbol files is; it's usually the first part of the missing file. In the above example, it's hello-486956f9dde465e5.9elsx31vb4it187.rcgu.o.
You can load this into gdb with the following command (changed as appropriate):
symbol-file /Users/user/git/gdbgui/examples/rust/target/debug/deps/hello-486956f9dde465e5
2.) The GDB pretty-printing macros that Rust ships with. GDB can't find these by default, which makes it print the message
warning: Missing auto-load script at offset 0 in section .debug_gdb_scripts of file /home/temp/myprog/target/debug/myprog.
Use `info auto-load python-scripts [REGEXP]' to list them.
You can safely ignore this, but the Rust issue
describes the workarounds necessary (create a .gdbinit file and paste a few lines into the Python helper script).
- On Windows Rust defaults to the MSVC toolchain, and
gdbguican't debug binaries compiled that way. If you want to usegdbgui, you'll have to switch to the GNU toolchain. - If you want to debug programs compiled in Release mode, you will need to create a
profile.releasesection in yourCargo.tomland adddebug = trueto it. See the Cargo manifest for details.
and now gdb will be able to see which files were used to compile your binary, among other things.
Connecting to gdbserver
Like gdb, gdbserver is also made by gnu, but with the following important differences:
- it is much smaller than gdb
- it is easier to port to other architectures than all of gdb
gdbserver runs on a remote machine or embedded target, which, as the name suggests, runs a server. gdb communicates with gdbserver so you can debug on your local machine. To do this, the remote machine must run the server and program:
gdbserver :9000 mybinary.a
Then you can launch gdb or gdbgui and connect to it. In gdbgui, use the dropdown to select Connect to gdbserver, and enter
<remote ip address>:9000
Read more at the gdbserver homepage.
If the machine gdbgui is running on and the target being debugged have different architectures, make sure gdb is built properly (see Remote Debugging Between Different Architectures).
Remote Debugging Between Different Architectures
For example, this is useful if you are working from an x86_64 based PC gdb client with gdbgui, to ARM arch gdbserver.
You need to build the gdb client with the --host and --target flags. You need to build the gdbserver for the correct architecture.
Build the gdb client that gdbgui will use. This example applies to an x86_64 pc running gdbgui that connects to an arm device running gdbserver, so you will need to ensure the targets apply to the environments you are working in:
- downloaded latest gdb source code
- unzip it, go into folder 3.
./configure  --host=x86_64-pc-linux-gnu --build=x86_64-pc-linux-gnu --target=arm-linux-gnuabi &&
make -j8 &&
sudo make install
- Now arm-linux-gnuabi-gdb is installed by default to
/usr/local/bin, but you can instead provideprefix=<path>to where you want it to install in the ./configure script above - The
arm-linux-gnuabi-gdbbinary can now be used by gdbgui to connect to the ARM device:
gdbgui -g arm-linux-gnuabi-gdb
Links: * Building GDB and GDBserver for cross debugging * http://www.brain-dump.org/blog/entry/138/Cross_Arch_Remote_Debugging_with_gdb_and_gdbserver * support remote debug from x86_64 based PC gdb client with gdbgui, to ARM arch gdbserver (multiarch)